
Effort Spots is a new feature in Crickles that is extremely useful for tracking fitness. This powerful tool can offer insights on real and virtual bike rides whenever a power meter and heart rate monitor have both been used. For such activities, the Effort Spots report gives a heat map showing the proportion of time spent at each heart rate and power level. Intuitively, this is what we most want to know from a fitness perspective yet, as far as I’m aware, it’s not available on any other platform.
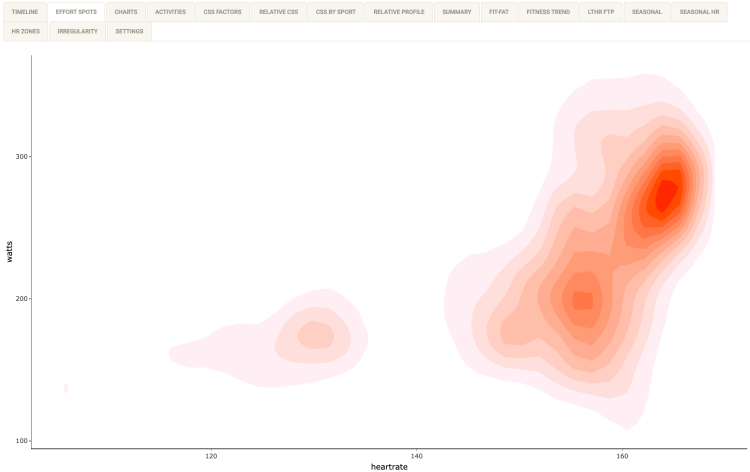
The “spots” with deepest coloration are where most time is spent. In this example, this main spot is at around 165 bpm and 275W, with a secondary spot at around157 bpm and 200W and a third, off to the left, at around 130 bpm and 180W. Exact values on the plot can be explored by hovering to see (heart rate, power) coordinates – 165 bpm and 271W in this example:

It is particularly useful to compare Effort Spots for two different activities, especially when the same ride or turbo workout has been done at two different times. To see this, select a Reference Activity in the sidebar. A simplified plot in blue for the reference activity will be overlaid on the main plot:

In this example the main plot, in reds, has similar contours to the reference plot in blue but the spots are relatively leftwards in the main plot, indicating that more time was spent at lower heart rate levels, and higher, indicating that more time was spent at high power levels. We can conclude that the cyclist enjoyed a higher level of fitness at the time of the primary plot than at the time of the reference plot.
It is sometimes helpful to locate the effort spots with reference to training zones for heart rate and power. The checkbox in the sidebar enables you to see these:

With the box now checked, gridlines divide the plot into five heart rate zones based on an estimate of current Lactate Threshold Heart Rate (LTHR), and six power zones based on an estimate of current Functional Threshold Power (FTP). For example, the main/reddest spot is located in heart rate zone 5 (out of 5, counting from the left) and power zone 5 (out of 6, counting from the bottom). The zone lines can be used with a reference activity too: they always show zones based on current LTHR and FTP values, not zones at the time of the activity.
The screenshots above were based on a turbo session. Out on the road there is also (except on a fixie) freewheeling, and a corresponding amount of time spent at or near zero power:

In this example, the coloured areas rising from the x-axis where power is close to zero represent time spent coasting.
On some plots you will see shapes having straight edges and other non-natural patterns in the “cool” areas. These are not “wrong” but simply represent a limitation of the plotting method where the data is sparse. Similarly, in some areas of white space – say at 140 bpm in the first example above – there will have been some activity but just not as much as in the areas that are coloured.
Effort Spots are not currently available for activities that you marked as Private on Strava.
Sounds useful, and I’m courious about it, but in my account in Navigator only the same one 2019-session is displayed, and the list to pick from only has that one to select. Also, the reference box and list is empty.
I’ve tried Chrome, Safari for Mac, Safari for iPhone; same thing.
My Strava-activities are not private, should be fine.
I wonder why, and if anyone has Effort Spots up and going?
Hi. Thanks for the feedback. Sorry to hear that this isn’t working for you – I’ll check it out when I get a moment. To your question, I’ve had a look at the logs and over the past year Effort Spots has been the 7th most visited page with a large number of people coming back to it hundreds of times (in just one year!). However, that doesn’t help you so I will look into your case. If anyone else reading this is having similar issues please do let us know by reply. Thanks! Ian
I’ve had a look at your data and it seems that since that one session you haven’t done any rides with a power meter. If that’s the case then that explains why nothing new is showing up on Effort Spots as it requires both heart rate and power data. If you do have rides with power perhaps you could contact me directly at ian@crickles.org. Thanks!
Great, that’s it!
In fact, I’never ridden with a power meter; my few recorded ones are erroneously picked up from other riders via Bluetooth. Thanks! Asger.
No problem, thanks for confirming.