
If you’re new to Crickles you can begin by using it for these three quick checks:
Check 1: Gauge your cardiac stress
On the landing page [Relative CSS] of the Navigator select your name in the Athlete: dropdown to get a screen like this:

The green bar shows you (me in this example) and where you rank amongst Crickles athletes for accrued cardiac stress over the past six weeks. This is based on activities you’ve entered on Strava with a heart rate monitor. If you’re way over on the right hand side you should be aware that you’re taking on a higher cardiac load than most other Crickles athletes. If you’re towards the left hand side you’re taking on less than the others (assuming that you regularly use a HR monitor and upload your activities).
Personally, I aim to be about where I am here: towards the right but not bang up at the end.
Check 2: Gauge your event readiness
If you have a race or special event coming up in the next few days, go to the Fit-Fat tab on the Navigator to see a page that looks like this:
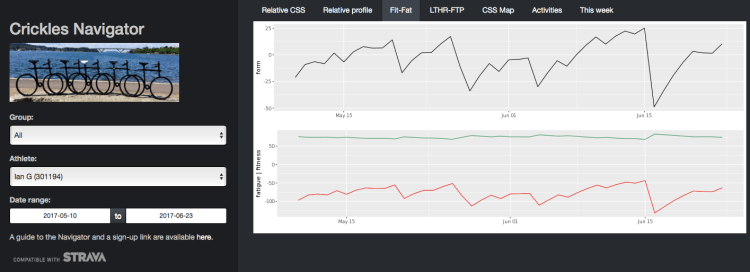
Focus on the black graph: this shows Form. If you’ve been holding at or above about 10 for a few days and you’re now hitting 20-25 you’ll be in great shape for your event. If you’re in negative numbers you’re under-recovered. It’s normal to have negative Form numbers during training but tapering prior to an event enables the Fatigue (the red line) to fall away while Fitness (the green line) can remain high. Form is the difference between the two.
Obviously, if you’ve haven’t been doing any training a taper period won’t help!
Check 3: Compare a specific activity with a friend
If you have someone you exercise with who is also on Crickles, whenever you do the same activity together you can compare your efforts using Crickles Activity Charts.
Again, select yourself from the Athlete dropdown then select the Activity that you did with your training partner. Next, check the Compare another? box and choose your training partner and their record of the same activity. At this point the Metric dropdown will be populated with the set of metrics that you both have available.
 In this example, Sean and I both used HR monitors and power meters so I could select altitude, cadence, kmh, heartrate or watts. Here, I’ve selected heart rate.
You may prefer to choose Distance rather than Time for the x-axis if you didn’t go round together. Here, I’ve checked the Smooth? box too to give a clearer picture.
This enables you to see where you and your partner were putting in relatively more/less effort. (In the example shown, I started off harder then my ride partner, Sean, put in a big effort on the hills in the middle of the ride while I took advantage of a pace car.)
***
If you’d like more info on any of these topics or if you have any questions or difficulties, please get in touch through the Contact page.