
I thought the Z2 challenge would be easy. To date, four of us have done it and it seems not to be. Here’s how it stands with Mark in pink, Sean in gold, Stuart in blue and me in green (all based upon the last 50 minutes of the session):
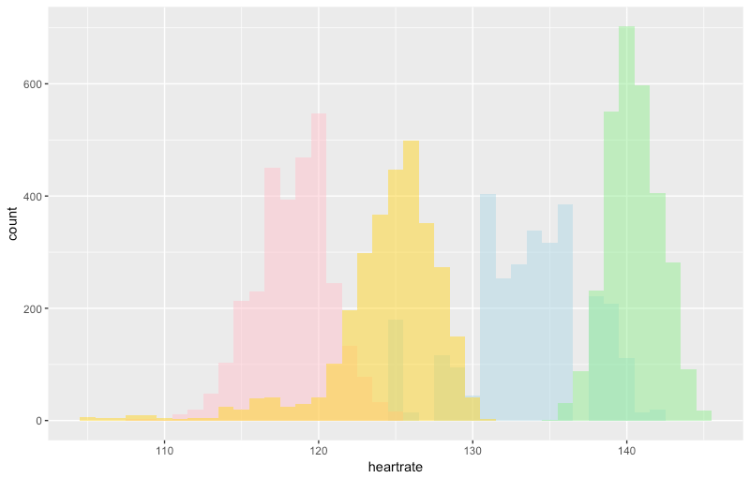
Conveniently, we all chose target heart rates that were far enough apart to generate largely non-overlapping distributions.
There are a few ways to measure the tightness of the distribution (other than by eye). The metric that I’ve chosen is to sum the absolute value of beat-seconds away from the mean heart rate over the period. When divided by 3,000 (50 minutes), this gives 2.0 for Mark, 2.5 for Sean, 3.0 for Stuart and 1.4 for me (lower is tighter/better). That’s an average in my case of 1.4 beats away from the mean. Of my 3,000 second-by-second HR samples fewer than 25% were bang on my target value of 140 bpm.
A few more of you have said that you plan to have a go at this (and I foresee a couple of re-tries from us four). Come on, people someone has to nail this!
Ian, what is the standard deviation for each of us?
Good question. I’ll check tomorrow and reply (I left my Mac in the office). I did think of using the interquartile distance to quantify the spread of the distribution but decided the beat-seconds measure was clearer. (It made no difference to the order.)
Standard deviations – Stuart: 3.8. Sean: 3.7. Mark: 2.5. Ian: 1.7.